Growth in a pool maintenance business is not just about adding more accounts. More pools mean more routes, more chemistry decisions, more customer expectations, more invoices and more chances for profit to leak out of the operation.
That is why the best operators do not manage by feel. They track a small set of metrics that show whether the business is becoming more reliable, more profitable and easier to run. The goal is not to turn every owner into a data analyst. The goal is to catch problems early, before they become callbacks, churn, unpaid invoices or burned-out technicians.
Why pool service metrics matter more as you grow
In the early days, a pool company can run on memory. The owner knows which gate sticks, which pump is loud, which homeowner texts after every visit and which route always runs long on Fridays. That works until the business adds technicians, neighborhoods, repair work or higher-volume billing.
Once the work spreads across people, vehicles and properties, the business needs a shared operating record. Metrics turn that record into decisions. They show which route is overloaded, which technician needs coaching, which service plans are underpriced and which customers are at risk of leaving.
Reddit is a useful place to see the customer side of these metrics. In r/pools, homeowners often discuss cloudy water, missed expectations and uncertainty about whether service was performed correctly. Broader Reddit searches for pool service missed visit show the same pattern: customers judge a pool company by reliability, proof of work, communication and how quickly problems get resolved.
Contractor-focused CRM articles make a similar point from the operator side. Resources such as Forbes Advisor's construction CRM guide and contractor business content from Jobber Academy often center on one idea: contractors scale better when customer history, estimates, jobs, follow-ups and billing live in a system instead of one person's head. For pool companies, the right metrics are the layer that makes those records actionable.
The 3 rules for useful metrics
A metric is only worth tracking if it changes behavior. A dashboard full of numbers that nobody uses is just another admin burden.
Good pool service metrics follow three simple rules.
- They have an owner: Someone knows they are responsible for reviewing the number and acting on it.
- They have a cadence: Some numbers matter daily, some weekly and some monthly. Mixing them together creates noise.
- They connect to a decision: A useful metric helps you reroute work, coach a technician, adjust pricing, follow up with a lead or collect payment faster.
The other mistake is tracking only company-wide averages. A pool maintenance business needs to see performance by route, technician, customer, service type and property. A 4 percent callback rate may look acceptable overall, but if one route is at 11 percent, the average is hiding the problem.
Core metrics every pool maintenance business should track
Use this table as a practical starting point. You do not need all of these on day one, but every metric below answers a question that affects margin, service quality or growth.
| Metric | How to calculate or source it | What it helps you decide | Review cadence |
|---|---|---|---|
| Scheduled visit completion rate | Completed service visits divided by scheduled service visits | Whether routes are realistic and dependable | Daily or weekly |
| Callback rate | Callback visits divided by completed visits | Whether quality issues are creating unpaid labor | Weekly |
| Route density | Completed stops per route mile or route hour | Whether service zones are efficient | Weekly or monthly |
| Revenue per route day | Maintenance revenue plus repair revenue per route day | Which routes produce the most value | Weekly or monthly |
| Gross margin by work type | Revenue minus labor, chemicals and materials where tracked | Whether maintenance, repairs and specialty work are priced correctly | Monthly |
| Chemical cost per maintained pool | Total chemical spend divided by active maintenance pools | Whether chemistry practices or pricing need review | Monthly |
| Out-of-range chemistry rate | Visits with readings outside target ranges divided by visits logged | Whether water care is stable or drifting | Weekly |
| Estimate approval rate | Approved repair estimates divided by estimates sent | Whether repair recommendations are clear and timely | Weekly or monthly |
| Open estimate age | Average number of days estimates remain undecided | Whether follow-up is too slow | Weekly |
| Invoice lag | Days between completed work and invoice sent | Whether cash is being delayed by admin work | Weekly |
| Days sales outstanding | Average number of days invoices remain unpaid | Whether collections are healthy | Weekly or monthly |
| Customer churn | Lost recurring accounts divided by starting recurring accounts | Whether retention needs attention | Monthly |
The exact targets depend on your market, service model, labor costs and customer mix. The value comes from trend lines. If callback rate is rising, invoice lag is stretching or route density is falling, the business is telling you where to look.
Route and labor metrics
Route performance is one of the first places a growing pool company loses profit. A route can look full on the calendar but still underperform if technicians spend too much time driving, searching for access notes or returning to properties because the first visit was incomplete.
Start with scheduled visit completion rate. If a technician regularly finishes fewer visits than scheduled, the problem may be route design, property complexity, poor notes, unrealistic stop counts or too much same-day disruption. A low completion rate also creates customer communication problems because homeowners expect a visit that never happens.
Route density matters because drive time is paid time that does not directly create service value. Track completed stops per route hour, drive time as a share of the day or revenue per route day. If one route covers too many scattered neighborhoods, the fix may be tighter service zones, different service days or better route sequencing. For practical ways to address that problem, SplashIQ's guide to cutting drive time for pool cleaner companies breaks down route design habits that directly affect this metric.
Labor utilization is another useful lens, but it should not be used to pressure technicians into rushing. A better question is whether the technician's paid day is being spent on value-producing work. If utilization is low, look for scheduling gaps, excessive warehouse time, missing parts, unclear job instructions or inefficient handoffs between the office and the field.
Service quality and chemistry metrics
Callbacks are one of the clearest signs that service quality is costing money. A callback is not just an extra visit. It affects route capacity, technician morale, customer trust and sometimes chemical or parts cost.
Track callback rate by technician, route, service type and cause. A green pool callback is different from a missed gate code, and both are different from a pump noise that should have been noted earlier. If you lump them all together, you lose the chance to fix the process.
Water-quality metrics deserve special attention because chemistry issues often build gradually. Track whether readings are logged on every visit, how often they fall outside target ranges and whether repeat imbalance happens at the same properties. A consistent water-quality log makes it easier to separate a one-time weather or usage issue from a service process problem. If repeat chemistry issues are common, the article on pool water chemistry mistakes that lead to repeat visits is a useful companion to this metric.
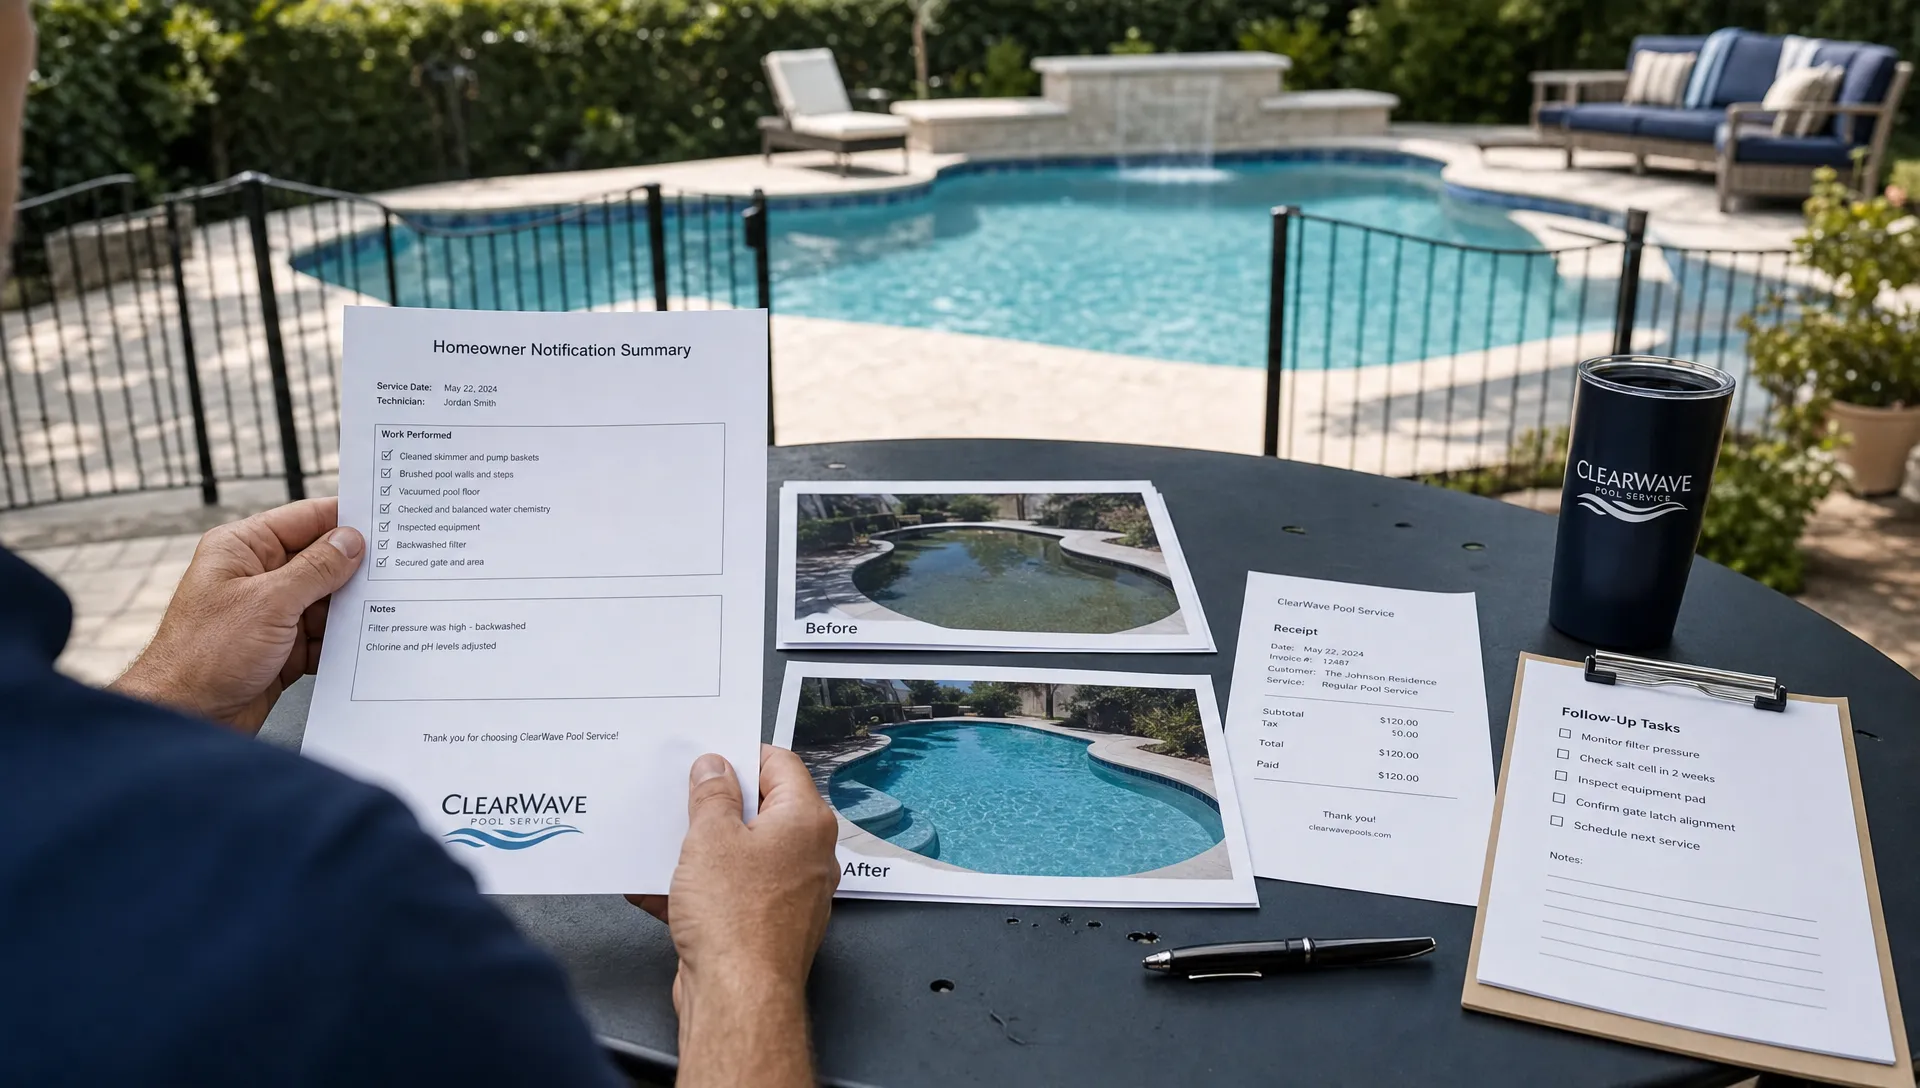
Photo completion and checklist completion can also be tracked as quality indicators. Before and after photos help confirm work was performed, protect the business when questions arise and give homeowners confidence without requiring a phone call. Checklists help standardize the visit so quality does not depend entirely on memory.
Revenue and margin metrics
A busy pool maintenance business is not always a profitable one. Revenue can rise while margin shrinks if routes are inefficient, chemicals are underpriced, repairs are missed or service plans do not reflect the real cost of the visit.
Track revenue per maintained pool, revenue per route day and gross margin by work type. Separating maintenance, repairs, green-to-clean work, equipment installations and specialty services gives you a cleaner view of what actually drives profit. If maintenance plans are underpriced, repair revenue may hide the issue for a while, but the business will still feel tight when labor or chemical costs increase.
Gross margin by work type is especially important because different services carry different costs. A weekly service visit has repeat labor, chemical use and travel time. A repair may require diagnosis, parts sourcing, homeowner approval, return scheduling and warranty notes. Pricing should reflect those differences. SplashIQ's article on pool service pricing models that protect your margins goes deeper into how to connect pricing to cost structure.
Repair conversion is another key growth metric. Many pool companies discover repair opportunities during maintenance visits, but revenue gets lost when recommendations sit in a notebook, photo roll or technician's memory. Track how many repair opportunities are identified, how many estimates are sent, how many are approved and how long approval takes.

Equipment and repair metrics
Equipment tracking helps turn field observations into future revenue and better customer service. Pumps, filters, heaters, automation systems, salt cells and cleaners all create repeat interaction points with the homeowner. If the business has no structured equipment history, technicians waste time rediscovering the same details.
Track recurring equipment issues by property. If a heater has been mentioned three times in six months, that should trigger a different follow-up than a one-time note. Track estimate close rate by equipment category so you can see whether homeowners are more likely to approve certain repairs when recommendations include photos, service history or clear urgency.
First-time repair completion is another useful metric. If repairs often require a second or third trip because parts, model numbers or approval notes were missing, the business is losing capacity. Better equipment records reduce wasted trips and make technicians look more prepared in front of homeowners.
Open estimate age is simple but powerful. If an estimate sits for 14 days without follow-up, the customer may assume it was not important or may call another company. A weekly review of open estimates helps the office recover revenue that is already close to closing.
Cash flow and billing metrics
Pool service companies can be profitable on paper and still feel cash-starved if invoicing and collections are slow. That is why cash flow metrics deserve the same attention as route and quality metrics.
Invoice lag is the first number to watch. If work is completed on Monday but not invoiced until Friday, the business has voluntarily delayed payment. Same-day or next-day invoicing is one of the simplest ways to improve cash flow without raising prices.
Days sales outstanding shows how long invoices remain unpaid on average. A rising number can signal unclear payment terms, slow follow-up, billing disputes, missing documentation or customers who need a more convenient payment option. Track past-due balances by age so the office knows where to focus collection efforts.
Payment method adoption can also matter. If more homeowners use online payments or stored payment methods where available, collections usually become less manual. The metric to watch is not just whether payment options exist, but how many customers actually use them.
For a deeper operational view of billing discipline, SplashIQ's guide to pool contractor accounting habits that protect cash flow covers habits such as separating maintenance and repair revenue, reviewing cash weekly and avoiding delayed invoicing.
Customer communication and retention metrics
Homeowners rarely see the full complexity of your operation. They see whether the technician arrived, whether the pool looks better, whether the message was clear and whether billing made sense. Customer communication metrics help you manage that experience before complaints show up as cancellations.
Track arrival notification delivery, service summary completion and response time to homeowner questions. If homeowners receive clear arrival and service notifications, fewer routine questions land on the office. If summaries include photos, readings and notes, the homeowner has proof that the visit happened and understands what was done.
Churn should be reviewed every month. Count lost recurring accounts and categorize the reason whenever possible. Price objections, moving homes, service quality concerns, communication issues and route changes all point to different fixes. A single churn number is less useful than a churn number with reasons attached.
Customer complaint themes are worth tracking even if the volume is low. Three complaints about unclear invoices may matter more than ten one-off questions. Patterns help you fix the system instead of treating every complaint as an isolated event.
Marketing and sales metrics
Marketing metrics keep growth from becoming guesswork. A pool company may get leads from referrals, search, local ads, trucks, neighborhood groups, social media or partnerships with builders and real estate professionals. Each channel should be judged by the quality of accounts it produces, not just lead volume.
Track lead source, lead response time, qualified lead rate and lead-to-customer conversion. If one channel produces many unqualified price shoppers and another produces fewer but better-fit recurring accounts, the second channel may be more valuable.
For recurring maintenance, also track time from first inquiry to first scheduled service. A slow intake process can lose good customers even when demand is strong. The faster the office captures property details, service needs, access notes and billing information, the easier it is to turn interest into a route-ready account.
Technician scorecard metrics
Technician scorecards work best when they are used for coaching, not blame. The goal is to make expectations clear and identify where training or process support is needed.
Useful technician metrics include visit completion rate, checklist completion, water-quality log completion, photo completion, callback rate and customer feedback. Review them in context. A technician assigned the most complex route may have lower stop counts but excellent quality. Another may complete many visits but generate avoidable callbacks.
Scorecards are most helpful when paired with field notes. If the numbers show a pattern, the next step is to understand why. Maybe a technician needs more chemistry training. Maybe the route is overloaded. Maybe access notes are incomplete. Maybe the schedule includes too many repair add-ons during maintenance days.
How to turn metrics into a management routine
The easiest way to fail with metrics is to review them only when something feels wrong. Build a simple cadence instead.
Weekly, review route completion, callbacks, open estimates, invoice lag, past-due balances and urgent customer issues. This keeps operational problems from spreading into the next week.
Monthly, review gross margin by work type, revenue per route day, customer churn, lead source performance, chemical cost per pool and technician scorecard trends. These numbers help with pricing, hiring, route redesign and training decisions.
Quarterly, step back and look at the business model. Which neighborhoods are profitable? Which service plans need adjustment? Which routes are ready for another technician? Which customer types create the most friction? Metrics should guide these decisions before growth adds more complexity.
If your data is scattered across paper checklists, spreadsheets, texts and disconnected payment tools, start small. Pick five metrics: scheduled visit completion rate, callback rate, revenue per route day, invoice lag and customer churn. Once those are reliable, add chemistry, repair and marketing metrics.
Frequently Asked Questions
What is the most important metric for a pool maintenance business? There is no single best metric, but callback rate is one of the most useful because it connects service quality, route capacity, labor cost and customer satisfaction. Pair it with revenue per route day and invoice lag for a balanced view of operations, profit and cash flow.
How often should pool service metrics be reviewed? Operational metrics such as completed visits, callbacks and invoice lag should be reviewed weekly. Margin, churn, lead source performance and technician trends are usually better reviewed monthly. Route design and pricing decisions can be reviewed quarterly unless a problem appears sooner.
Should small pool companies track metrics before they hire technicians? Yes. Tracking basic metrics early makes hiring easier because the business already has a repeatable process. Even a one-truck company benefits from knowing which customers are profitable, which visits create callbacks and how quickly invoices get paid.
Can software help track pool maintenance business metrics? Yes, especially when scheduling, CRM records, field notes, water-quality logs, equipment history, photos and payments are connected. Metrics become much easier to trust when they come from the work your team already completes each day.
Run your pool service business with numbers you can trust
SplashIQ helps pool service companies replace spreadsheets and paper checklists with one operating system for the office, technicians and homeowners. With CRM, smart route scheduling, water-quality logs, equipment tracking, homeowner notifications, before and after photos, online payments and technician scorecards, your team can manage the full workflow from first lead to final invoice.
If you want cleaner routes, clearer service records and better visibility into the metrics that drive growth, visit SplashIQ and see how one connected platform can support your pool maintenance business.